
We’re thrilled to announce that Glorify is officially partnering with Contra! This collaboration opens up exciting opportunities for designers, marketers, and creators in the Glorify community.
Posted Nov 9, 2022
•
9 min read

graphic design

Create beautiful marketing graphics at scale.
15 Graphic Organizers to Help Visualize All Your Big Ideas

For instance, when we generate content without strategizing or planning, we tend to make errors that, in turn, lead us to waste time and not be as efficient as we would like. That’s why graphic organizers are so functional.

The Different Types of Graphic Organizers
There are many types of graphic organizers, each with a particular purpose and method of thinking.
In this post, Glorify will introduce you to 15 innovative graphic organizers to help you visualize details so that you can stay organized and add to all your concepts.
1. Circle Map Graphic Organizer
The aim of the circle map is to formulate an idea or theme using relevant data. It consists of a circle within another larger circle, where the central theme or concept is the main focus. Encircling the central theme is the larger circle in which the related concepts move. As the second circle fills up, the interactions and meanings expand both gradually and creatively. In the second circle, the main concept is described by any form of wording such as nouns, adjectives, and even phrases.
How to use it
Circle maps are useful for strategizing the very start of an idea. You can use it on a whiteboard for a brainstorming session at a party. With the aid of a circle diagram, brilliant ideas will begin to take shape and ultimately become fully functional and dynamic.

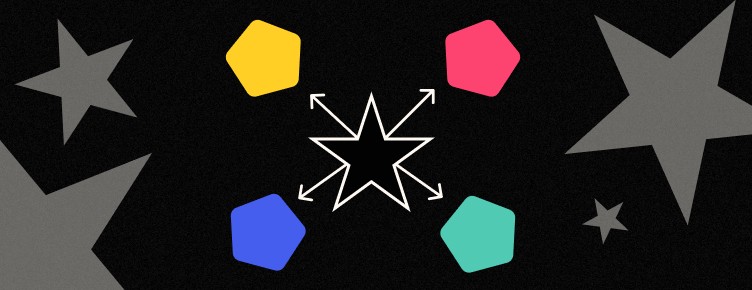
2. Spider Map Graphic Organizer
The aim of the spider map is to establish the main theme with clear descriptive relations. In this case, the center circle emerges from other circles that encircle it, producing a visual image of a spider. Each linked leg and circle will have an adjective or phrase description.
How to use it
While circle maps are used for organizational activities, spider maps are better suited to explain a subject. In a marketing environment, you can use a spider map to identify the characteristics of a specific audience.

3. Idea Wheel Graphic Organizer
The idea wheel is like a combination of the circle map and the spider map. This graphic organizer focuses on creative thinking and arranging ideas at the same stage. The main theme being examined appears in the center of the chart. There may be other circles or shapes around it, a sectioned larger circle, or interconnected bubbles.
How to use it
The goal of using an idea wheel is to organize information numerically or as a series. Thoughts are applied to the main concept in particular sections and then clarified in the same circle or with a shape that stems from it. Idea wheels are effective for freestyle strategizing and organizing information on a specific subject. It helps to take notes when performing an analysis or forming a concept of a larger image.

4. Idea Web Graphic Organizer
The idea of a web graphic organizer is a blend of different spider maps. It’s simply a contrast organizer that identifies similarities and dissimilarities between concepts. The two central circles contain the key ideas of the web idea. Arising out of each are two styles of circles. There are shared resemblances in the first two stemmed circles. The circles on the sides explain the differences.
How to use it
Whenever you have to choose between two solutions to a question, a web-based idea will assist you in making a potential choice. The web concept can be a slide inside a presentation. It can show a comparative study between ideas. Idea webs will function just as well as illustrations. There is no need for the arrangement of the circles to maintain a particular grid. You are free to use your imagination when arranging the circles, as long as the ideas are clearly presented.
5. Concept Map Graphic Organizer
The concept map closely resembles the idea web. The difference is that the web idea is for contrasting while the concept map is for strategizing and arranging.
This type of organizational chart is typically very diverse and detailed.
How to use it
This type of graphic organizer is best for evaluating one specific topic rather than two or more topics simultaneously. It ideally suits individual use rather than infographic or presentation purposes. However, a concept map is often used for data visualizations that display relations between themes.

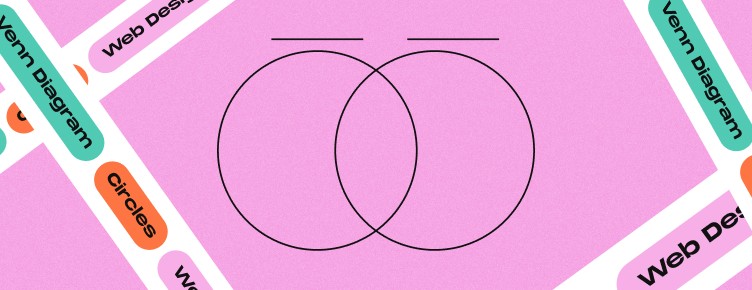
6. Venn Diagram Graphic Organizer
These graphic organizers are important for web concepts. The visual distinction is that the circles or sections overlap each other instead of being attached to the lines. Venn Diagrams are useful to identify similarities and dissimilarities between definitions.
How to use it
Similarities in the Venn diagram are positioned in a formation of two or more circles, while inequalities are inserted where the circles do not overlap. Venn diagrams may become very complicated, with several circles (or other patterns) overlapping in various places. Venn diagrams are used to show similarities and variations between a variety of distinct objects.
7. Tree Chart Graphic Organizer
The tree chart can be a huge benefit in the identification and organization of details. Visually, the tree map looks like a real tree, and some may even compare it to a family tree. The uppermost segment is the main title or theme, below which are the qualifying or sub categories. Below the subcategories, there is a list of related details.
How to use it
A tree chart may be used as a graphical overview for any form of a written task such as an article or blog post. The name and the overview are placed at the top and the paragraphs at the end.
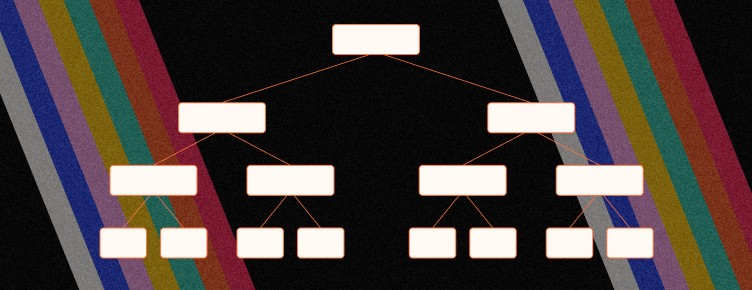
8. Organization Chart
Although it looks similar to a tree map, the organization chart has a specific target. The tree chart divides knowledge into parts that originate from each other as a grouping while the organizational chart is all about rank. The topics at the top of the map are for the CEO, CFO, etc. Below are supervisors, and so on in the organizational hierarchy.
How to use it
Organizational charts are most commonly used for a company’s internal activities. They help to digitally display the roles of leaders and anyone who falls after them. The very same method can be used to organize a working unit inside a business.

9. Sequence of Events Graphic Organizer
A chain of incidents is almost like a flowchart. This type graphic organizer is an illustration of a method, change, or collection of guidelines.
The key theme of a chain of events is placed outside the map in the rectangle that borders it. Linked shapes show the steps or progress of a sequence. Some of the shapes may include an extra shape connected to it to explain a specific idea.
How to use it
Sequence of events graphic organizers are mostly used in classrooms to explain the plot of stories and novels. However, they can come in handy in many circumstances, especially if there are ordered events.

10. Cause and Effect Map Graphic Organizer
The cause and effect map is among the most functional of all graphic organizers. It aims to describe the sources and consequences of certain cases.
How to use it
Start with the main event that will occupy the large center portion of the map. Through the main body, the other related shapes are left and right. The shapes on the left reflect the factors that assisted to make the situation occur. The shapes to the right are the results of the event selected. In certain cases, the result may also become a source, forming a vicious circle.

11. Brace Map Graphic Organizer
Graphically, the brace map appears like a tree chart on the edge. The exception is that the brace map extends over all sections of the main map.
This form of organizer must have the actual object or condition as the basic assumption. Ideas and theories are not necessarily what brace maps are about.
How to use it
The brace map helps to examine pieces of the object and the connection between them.

12. Analogy Graphic Organizer
The analogy organizer is a more functional example of a visual organizer and an efficient way to share information among people.
How to use it
This organizer is used to identify a connection between items and establish analogies. It’s a concept used to equate two items by displaying their similarities. An analogy organizer can be chosen to develop a storytelling form for a collection of written work. Another use of the analogy organizer is the orientation process of a new employee.

13. T-Chart Graphic Organizer
The T-Chart is a basic, very flexible organizational chart. Digitally, the T-Chart has a wide header at the top with the title and two columns filled with details on each subject. Graphically, it represents the letter T.
How to use it
It is primarily used to differentiate between two subjects. Its most prominent use is to evaluate the advantages and disadvantages of an action that needs to be taken.
The other graphical uses of this sort of organizational chart are to distinguish two items by their disparities. T-Charts are not for the purpose of identifying parallels between items.

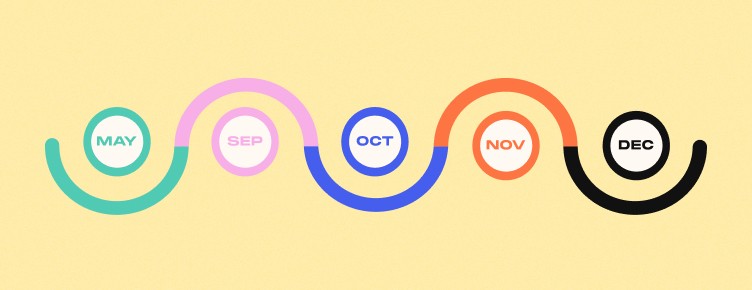
14. Timeline Chart Graphic Organizer
The timeline map is a long line that reflects a time frame. All along the graph, the linked shapes originate from events taking place during specific periods. The activities are arranged in sequential order.
How to use it
The mainline representing the time span can be visualized horizontally, vertically, or even as a free-hand structure. A timeline chart can often look like a chained series of activities. It can also be used to depict simple roadmaps or long term and short term plans.
15. Storyboard Graphic Organizer
The storyboard is the last organizational chart on this list. A storyboard resembles a basic cartoon book and aims to visualize a picture plot. The storyboard does not have to be a fixed page with circles, it can also be split into parts and utilized for artistic composition.
How to use it
A popular use for a storyboard is the creation of animation and movies. Each square in the storyboard will contain a particular plotline in the movie. Storyboards are also used by UX designers to build prospects and future scenarios where the website, software or product is utilized.

Create Your Own Graphic Organizer Easily Using Glorify
Organizing your workflow just got a whole lot easier with Glorify. You can easily create any type of graphic organizer you like, depending on your purpose and needs. The best part is, you don't have to stick to the rules You can customize your design to your heart's content and even add your brand colors for extra flair.
Here's a step by step guide on how to create a variety of graphic organizers using Glorify.
Circle Map Graphic Organizer
Step 1: Go to Shapes and choose a circle from the Shape section. A circle will appear on the canvas.

Step 2: Select the circle and click Shape Settings in the edit panel on the right side of the editor.
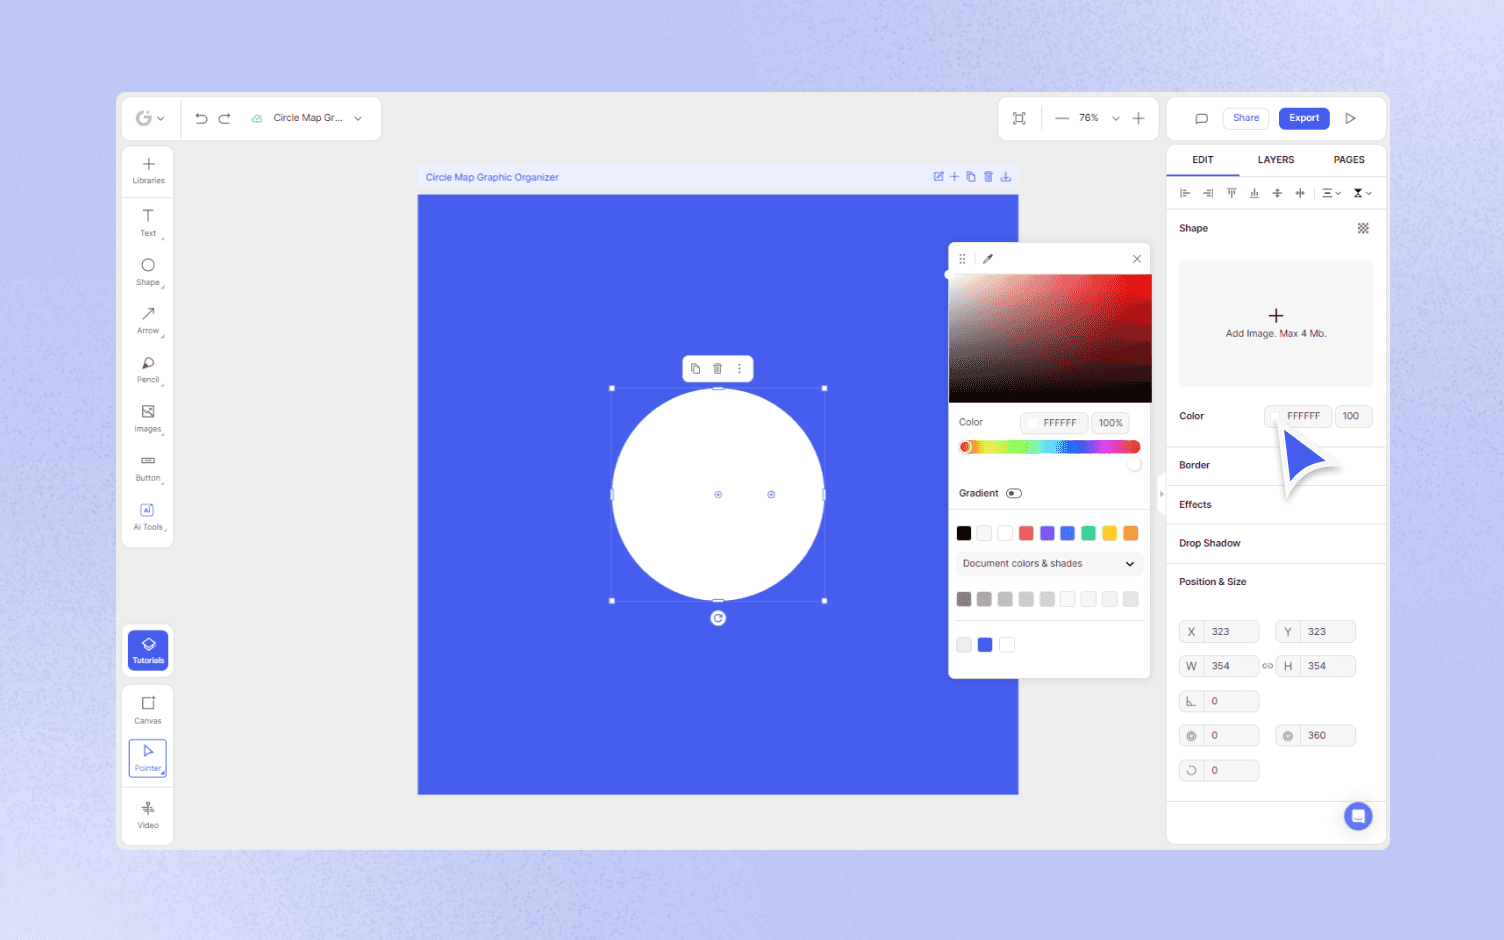
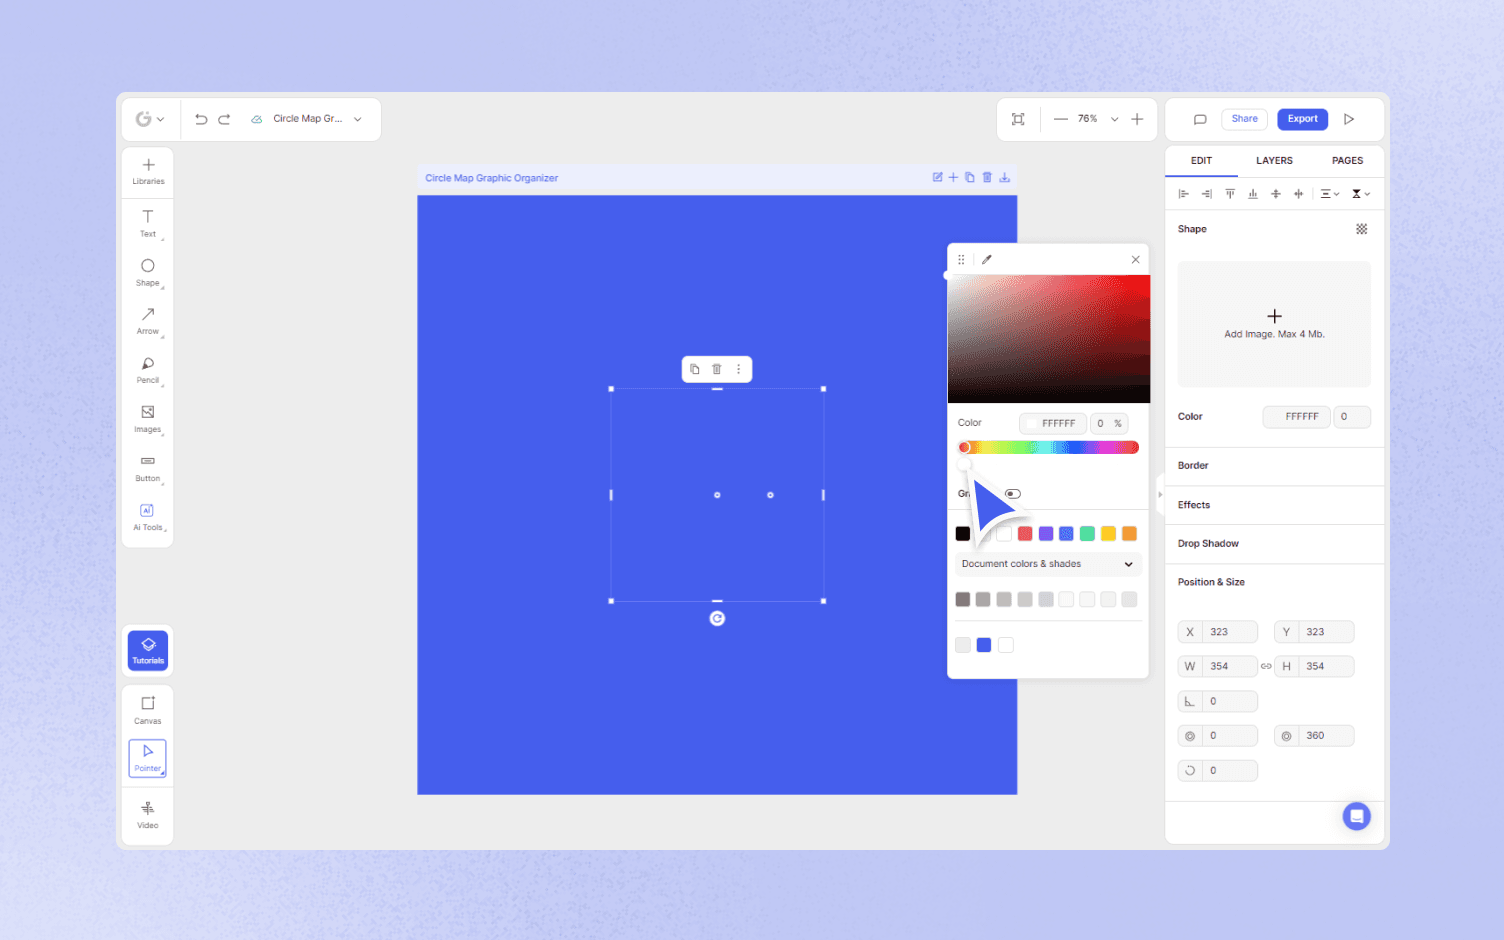
Step 3: Drag the colour to transparent in the colour palette to make the shape transparent.
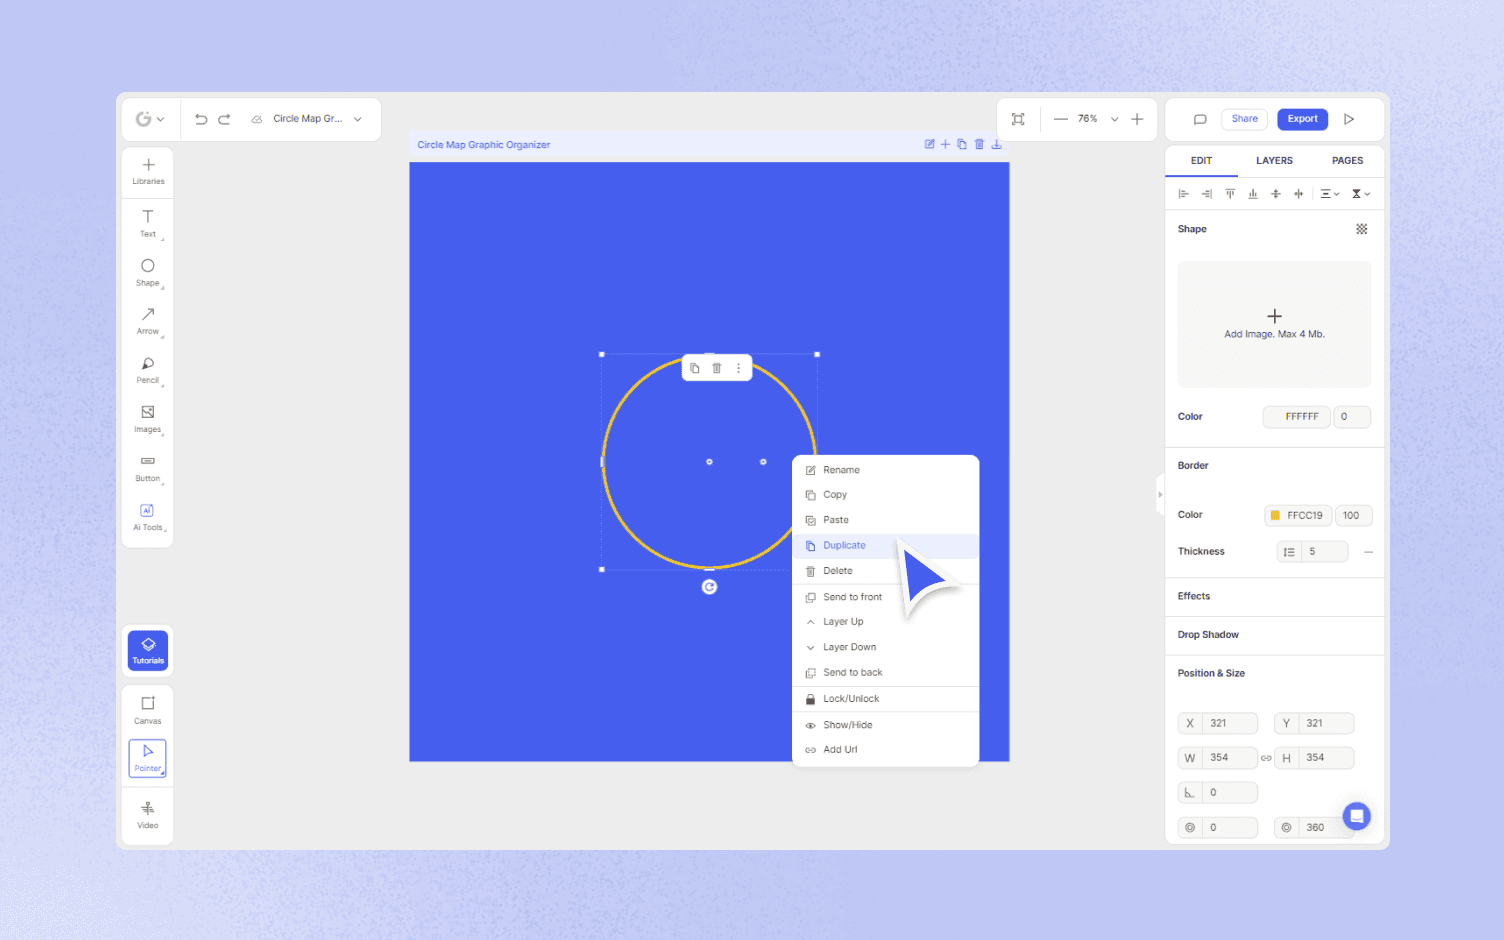
Step 4: Add border color to the shape and adjust the color and thickness of the circle border.

Step 5: Select the shape and you will see a duplicate icon over it or right click and select duplicate also you can press Ctrl + D on your keyboard to duplicate it.
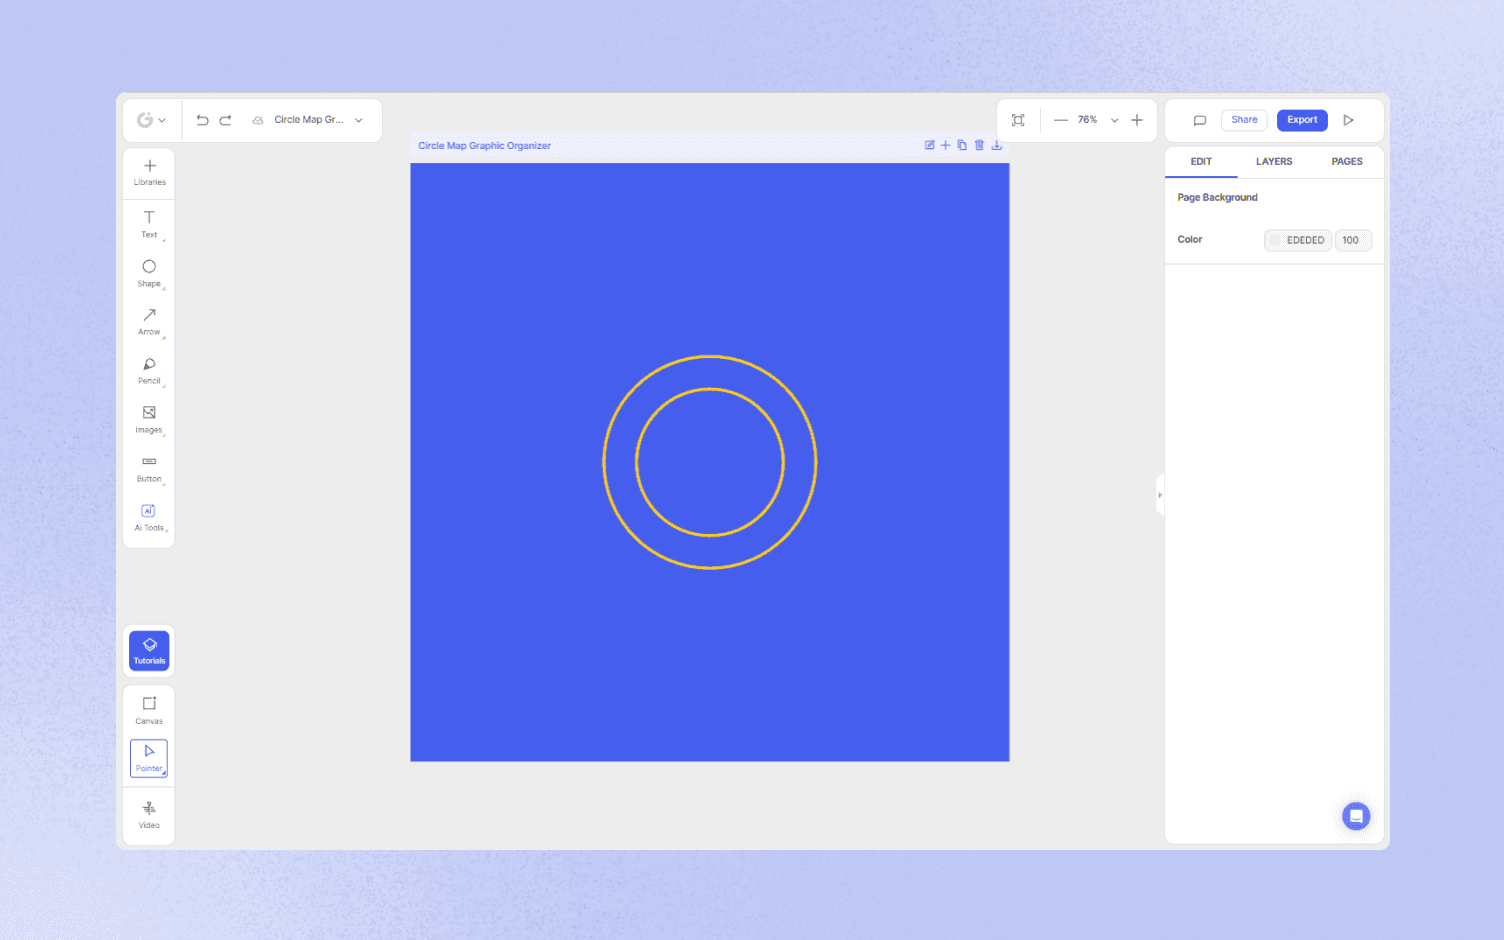
Step 7. Resize the duplicate shapes to a smaller size, then drag them into the center of the original circle.
Idea Web Graphic Organizer
Step 1: Click the Plus icon Libraries and go to the Shapes section, and open the Basic Shapes library.

Step 2: Select an Oval shape.
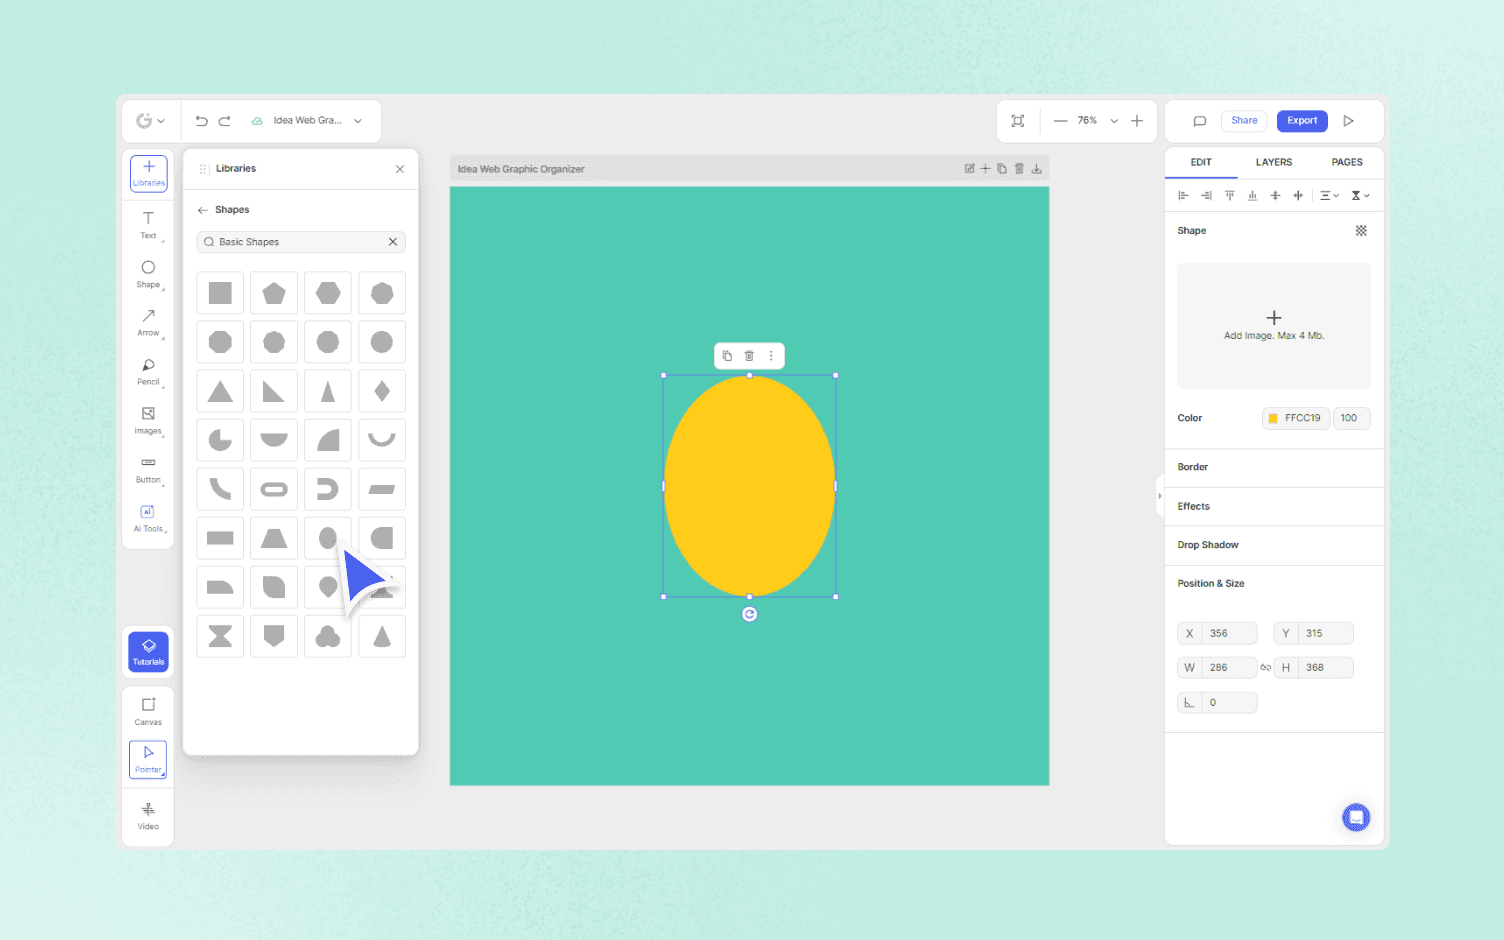
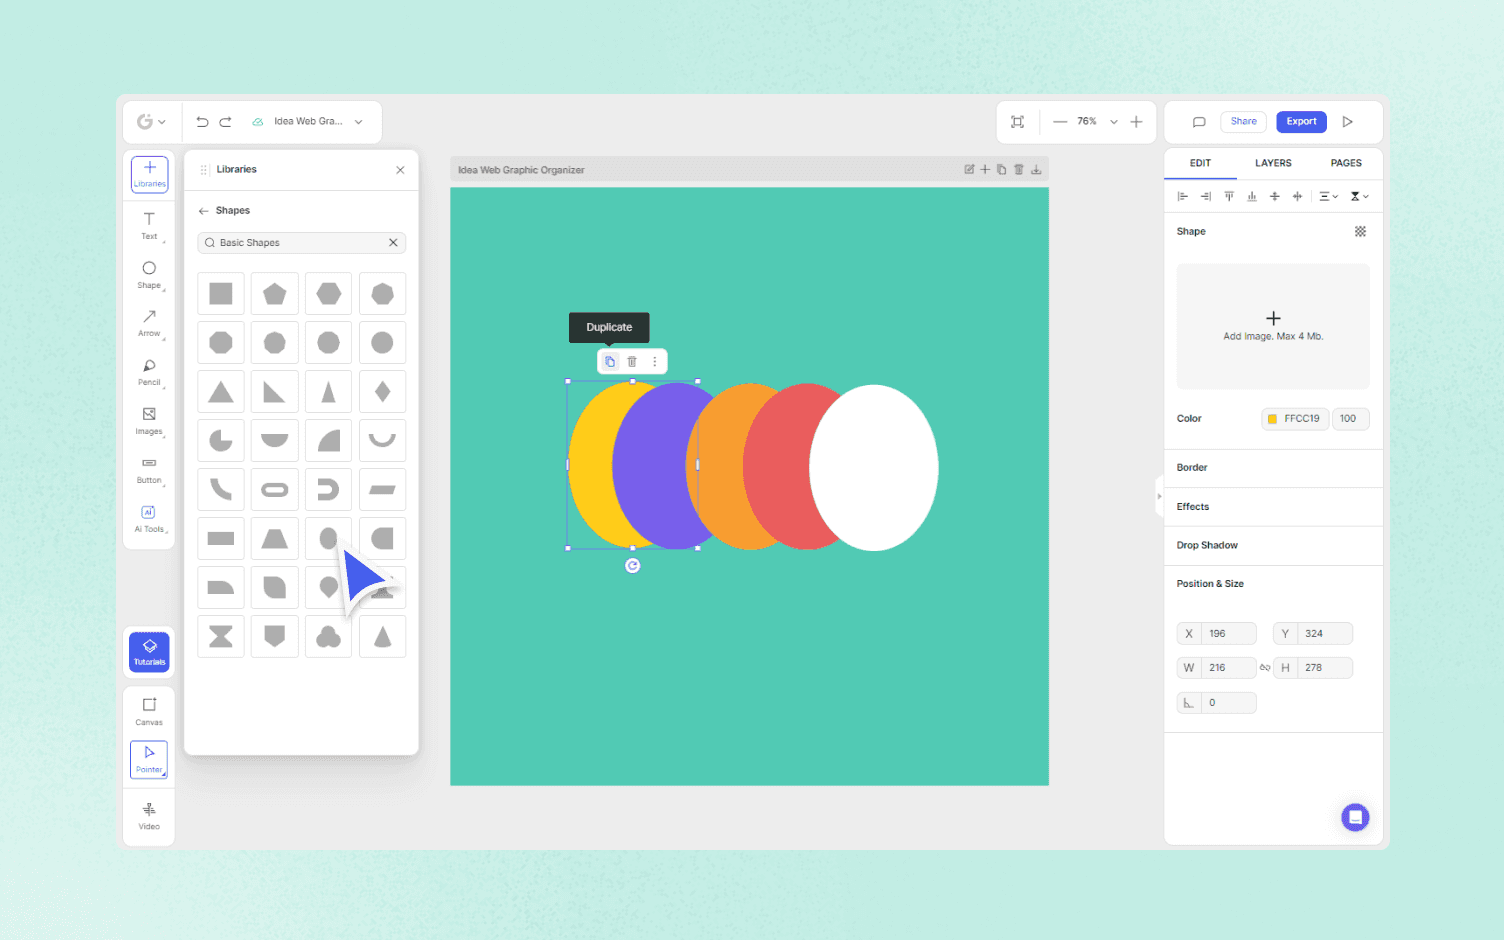
Step 3: Select the shape and you will see a duplicate icon over it or right-click and select duplicate also you can press Ctrl + D on your keyboard to duplicate the oval 4 times.
Step 4: Click the Arrow tool and choose the arrow you want to use.

Step 5: Select the arrow on the canvas and you will see a duplicate icon over it or right-click and select duplicate also you can press Ctrl + D on your keyboard to duplicate the oval 4 times. You can also change the colour of the arrow by going to the right-side of the canvas.
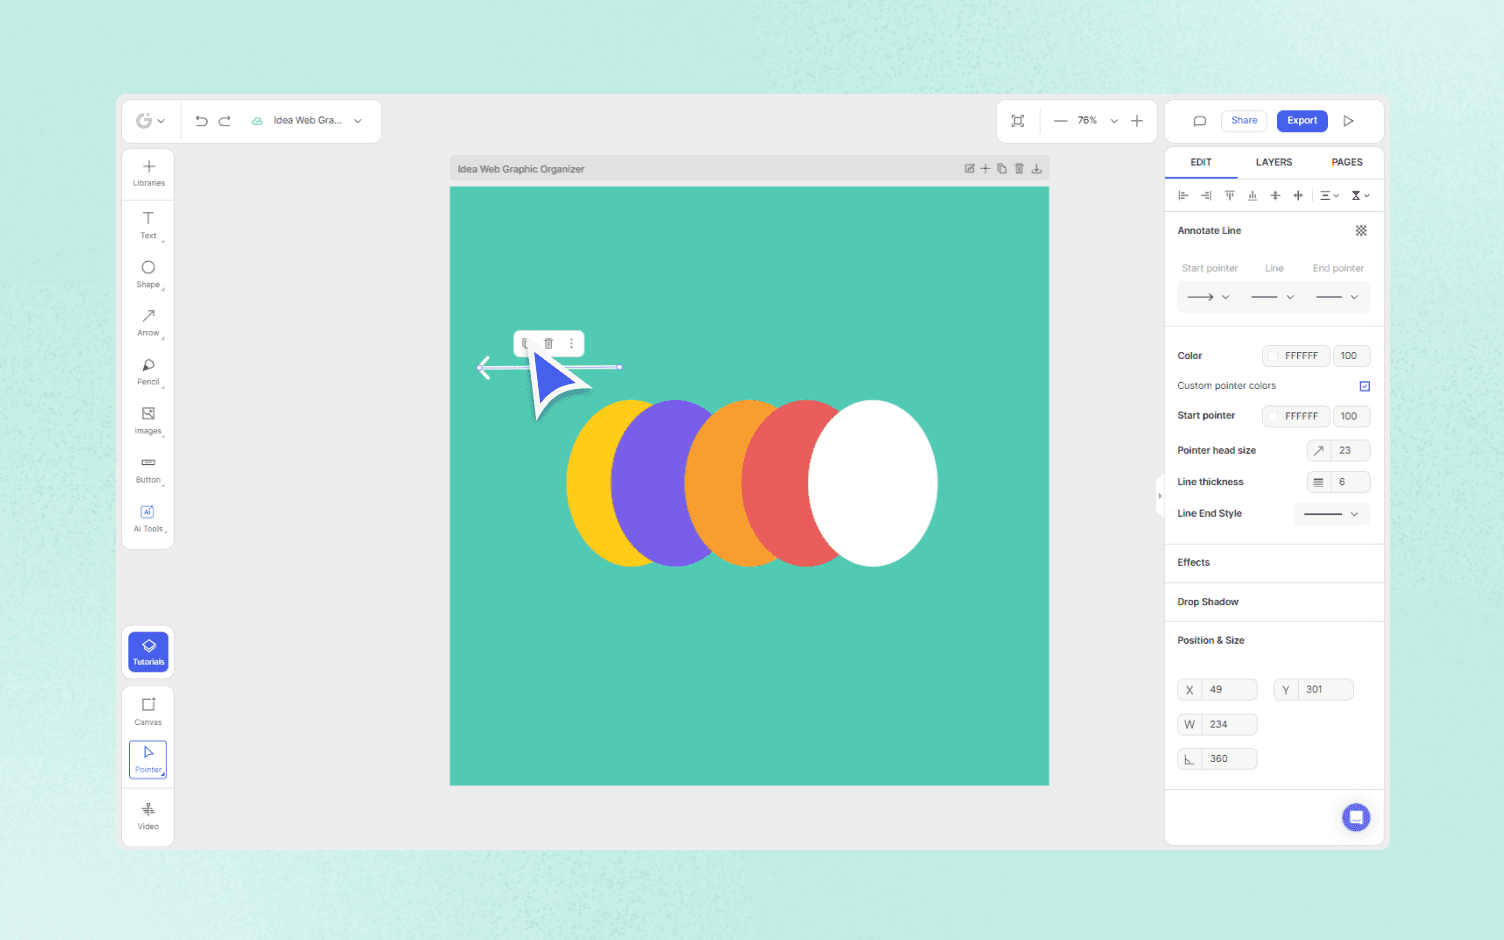
Step 6: Resize the arrow according to your liking, and place one shape in the center and move the arrows according to your layout.

Venn Diagram Graphic Organizer
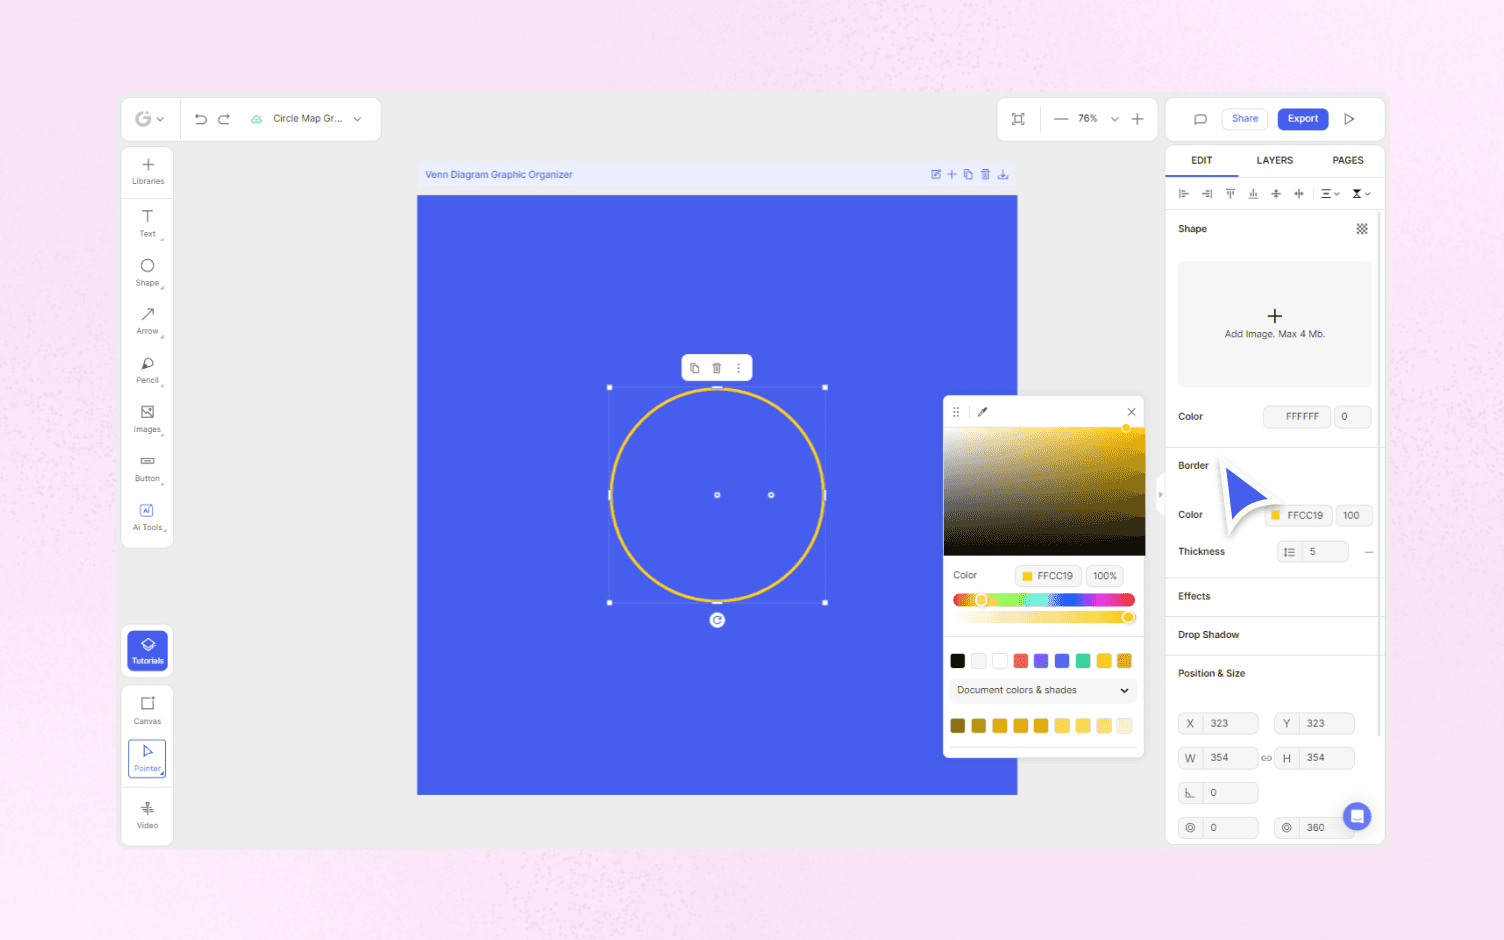
Step 1: Go to Shapes and choose a circle from the Shape section. A circle will appear on the canvas.

Step 2: Select the circle and click Shape Settings in the edit panel on the right side of the editor.

Step 3: Drag the colour to transparent in the colour palette to make the shape transparent.
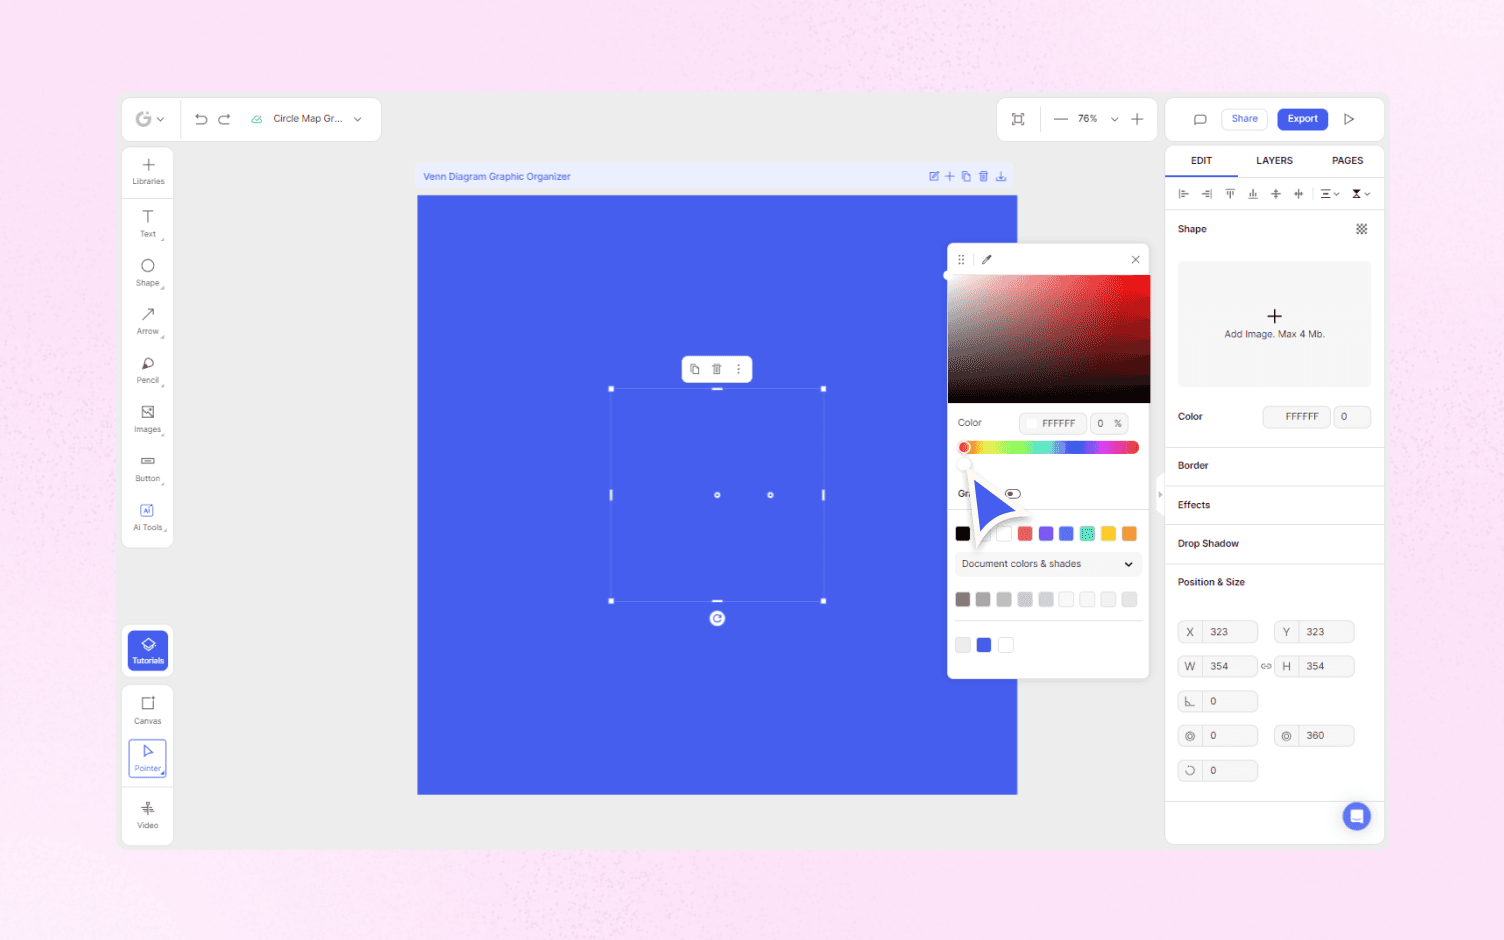
Step 4: Add border colour to the shape and adjust the colour and thickness of the circle border.
Step 5: Select the shape and you will see a duplicate icon over it or right click and select duplicate also you can press Ctrl + D on your keyboard to duplicate it.
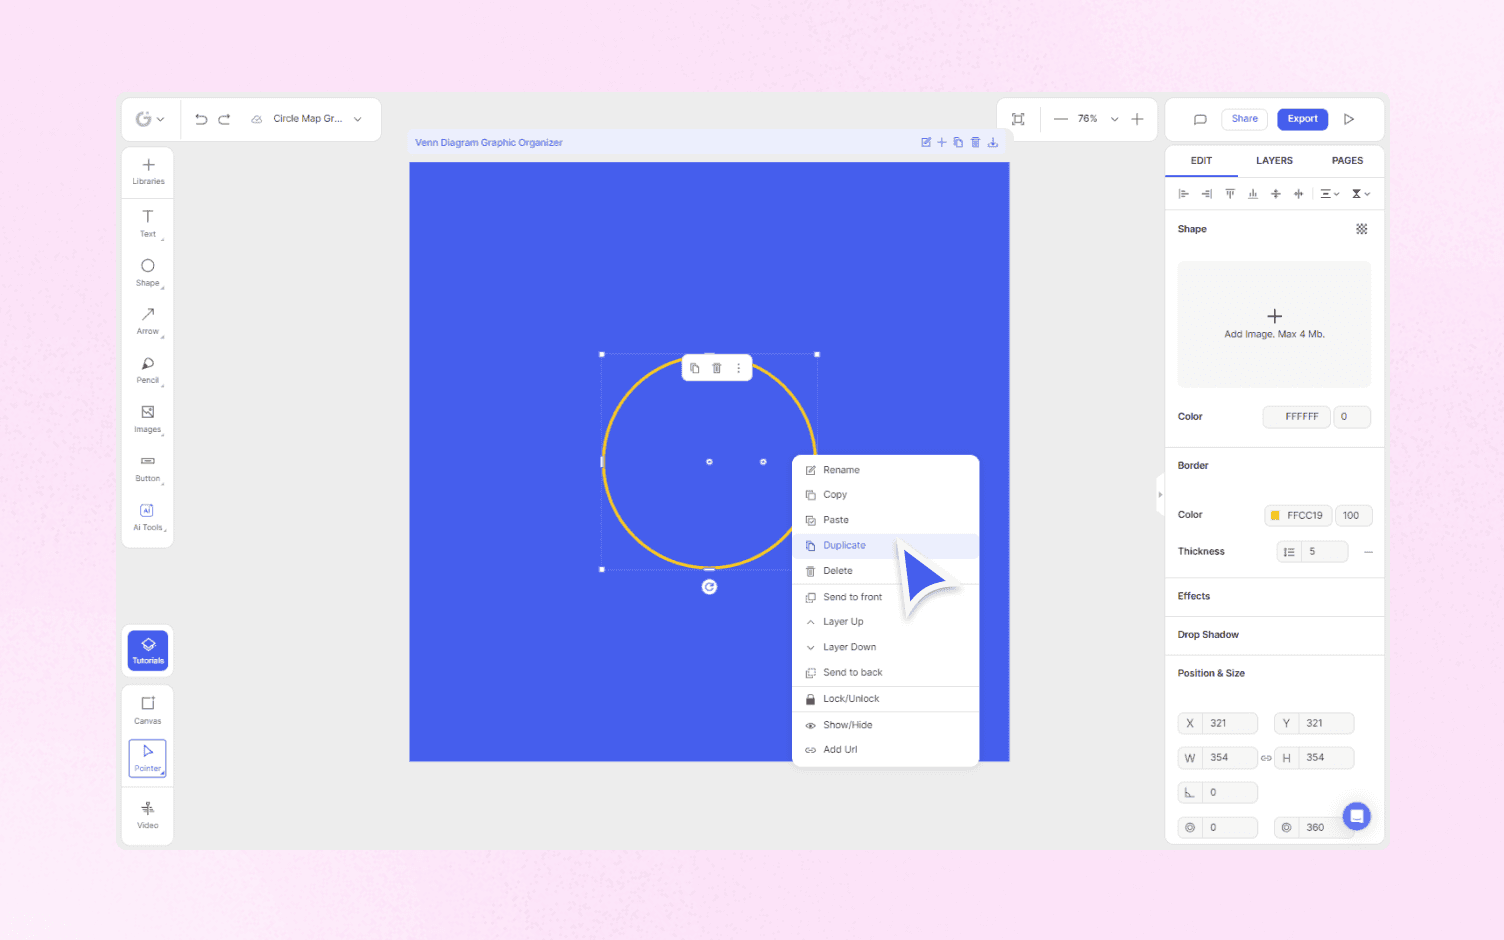
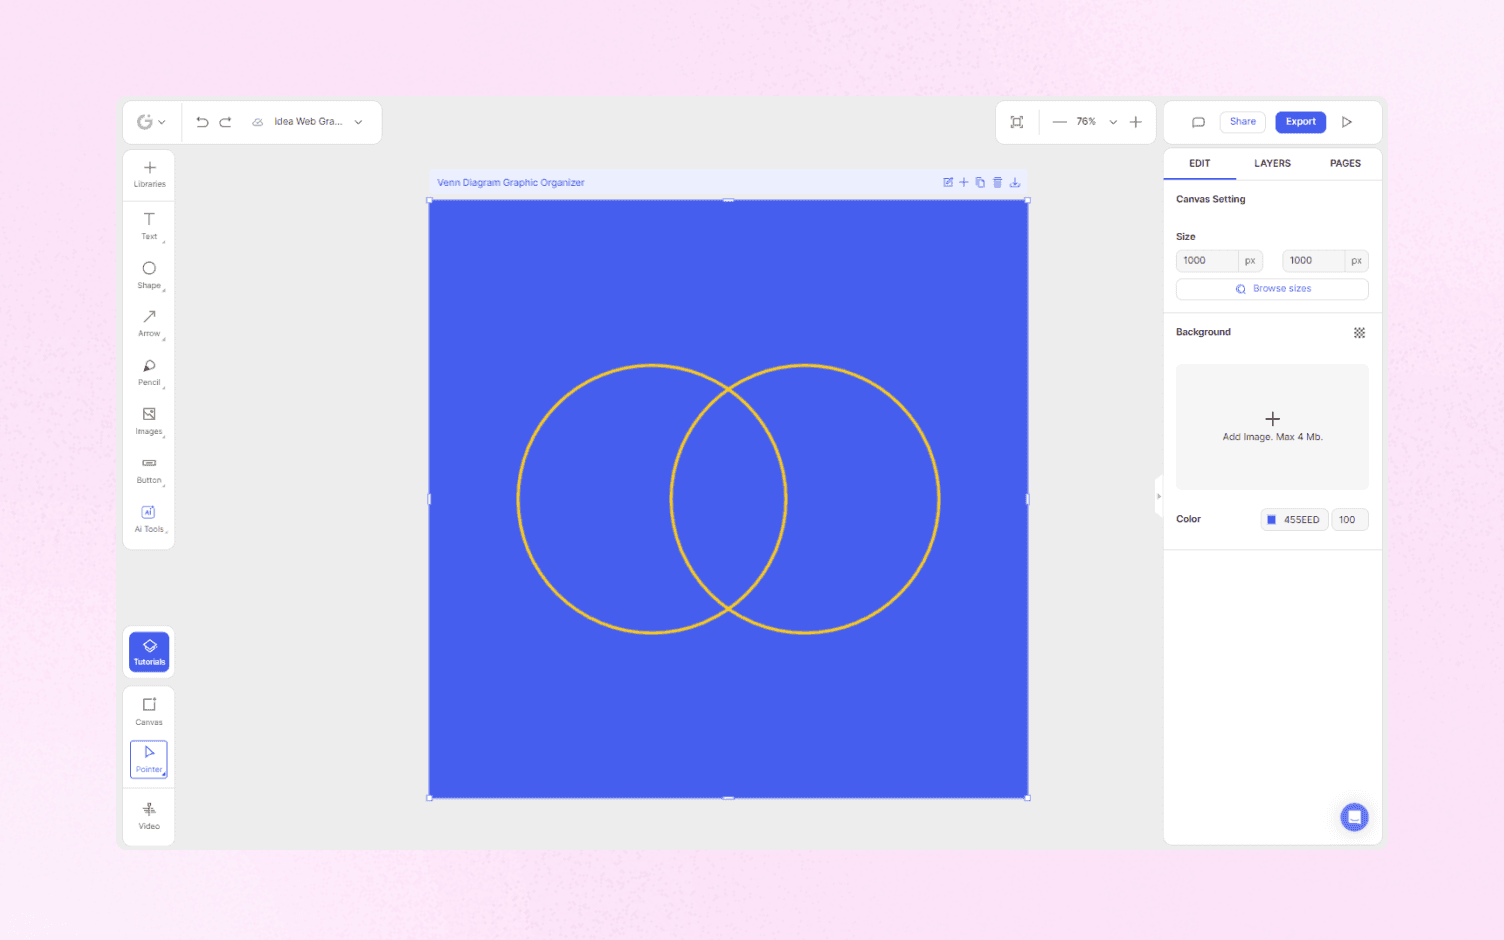
Step 6: Drag the circles to make them overlap.
Final thoughts
As you’ve seen, graphic organizers are a beneficial tool for any innovative, critical thought process. They enable us to visualize and communicate even the most abstract thoughts in simple, comprehensive ways. How do you plan on using graphic organizers? Which one of them is your favorite? Do let us know your thoughts, ideas, and queries in the comments below!
Start designing your own graphic organizer in just a few clicks with Glorify!
Types of Graphic Organizers: FAQs
1) What are graphic organizers used for?
Graphic organizers are used to map out ideas and visually represent concepts in a comprehensive way. By simplifying information, they make complex plans, problems and solutions relatively easy to understand.
2) What is a story graphic organizer?
A story graphic organizer or story map is a technique that enables people to understand the elements of a book or story using a graphic organizer.
3) How are graphic organizers used in writing?
As part of the creative process, graphic organizers are used to help students plan out concepts, story lines, character descriptions and scenarios before beginning to write.
4) What are the 8 types of graphic organizers?
There are many different graphic organizers. Some of the main types are circle maps, venn diagrams, idea webs, T-charts, idea wheels, tree charts and storyboards.
5) Is an infographic a graphic organizer?
Though the differences are subtle, an infographic is not classified as a graphic organizer. Infographics focus more on heavy aesthetics to keep people engaged. They often contain multiple data visualizations. Graphic organizers use simple shapes and designs to maintain practicality and most often display just one data visualization.


Features
Alternatives


© 2019-2024 Glorify App - All rights reserved.