


We’re thrilled to announce that Glorify is officially partnering with Contra! This collaboration opens up exciting opportunities for designers, marketers, and creators in the Glorify community.
3 Steps To Create An Infographic In Google Docs

What are Infographics?
Infographics are graphic visuals that show data, information, statistics, results, etc., in a visual way.
And although the main association on infographics is charts and diagrams, contemporary infographics are much more than that.

Modern-day infographics focus on visual effects and count on them to amplify their message.
Some of the most common infographics categories are:
Showing some timeline
Showing some process
Showing statistics
Comparing things
Informational ones, etc.
Regardless of their category, they all serve the same purpose: to captivate and educate your audience.
Why are Infographics Beneficial?
One of the greatest qualities of infographics is that they are universal, so you can apply them to any industry.
Since people react to images better than to longer chunks of text, a high-quality infographic can convey your message much faster and be much more impactful.
What other benefits are there?
To improve brand credibility - by providing factual and checked information, you can establish yourself as an expert in a certain industry.
To raise brand awareness - this one is closely connected to the former one. As your brand credibility rises, your brand awareness rises, too.
To get your business vision or idea across in a more interesting and captivating way.
To boost a decision-making process - once people have all the info laid out nicely and neatly, it is much easier for them to make an educated decision.

And the list could go on, but you’ve got the gist.
Now it’s time to see how to create an infographic in Google Docs.
How to Create an Infographic in Google Docs?
Step 1: Insert a Drawing
We skipped the obvious steps of going to Google Drive and opening your Google Docs sheet.
The first thing you should do is to click on the Insert function in the top toolbar. You will see a drop-down menu, and the option you should be looking for is Drawing. Click on the option New.

Step 2: Design Your Infographics
Once you’ve clicked on the New option, your screen should look like this:

At this point, you have a few options:
You can upload an image from your computer, URL, Google Drive, etc
You can insert a text box
You can insert shapes
All the icons that you need are in the top toolbar as you can see on the picture above.
So let’s say you uploaded an image. Now what?

Now you can add text by inserting a text box or by inserting shapes.
What might be the difference between the two? Well, with the text box, the shape stays the same, whereas with the Shape options, it can be versatile.
The latter option is good if you want to add more dynamics to your infographic.
To insert text, just click on the text box-a square with the letter T in it and start typing.
The process of typing your text is the same as in regular typing in Google Docs. You can choose fonts, styles, colors, sizes, etc.
From here on, you can add more text and images until you’re satisfied with your design.
Step 3: Save Your Infographic
The last thing to do is save your work. When you click on the blue Save and Close button in the right-hand corner, your infographic will automatically be uploaded to your Google Docs.

As you can see, in three easy steps, you can create an infographic.
However, with all due respect to dear Google Docs, this way of creating infographics is good if you don’t need to do any additional tweaks or more advanced editing.
Let’s see if another way of creating infographics offers more editing features.
How to Create an Infographic Using Google Slides?
Another way you can create infographics in Google Docs is by using Google Slides. To be more precise, you won’t create it in Google Docs but upload it there once you’ve finished.
Again, we’ll skip the obvious steps of going to Google Drive and choosing the option Google Slides.
Step 1: Insert an Image or a Diagram
The moment you land on your Google Slides presentation, you will see a striking difference in the number of elements you can use, compared to Google Docs.

You can import various themes and edit them accordingly. The process is the same as in Google Docs regarding the icons, their position on the toolbar, and functions.
Step 2: Edit Your Infographics
Google Slides is a great option if you want to create charts or diagrams. You just need to click on Insert and choose the option in question.
So if you decide to insert a diagram, you will see various options:
Grid
Hierarchy
Timeline, etc.

Depending on your choice, you will get more options in the right-hand corner, like colors, the number of levels, etc.

When you click on the template you want, you can then do further edits with text and colors.

Step 3: Save Your Design
When you are satisfied with all the edits, you can click on the Download option in the left-hand corner.

As you can see, Google Slides offers a few options. Since we talk about infographics here, you should choose either JPEG or PNG option because it will save your infographic as a picture.
And the last thing you need to do is to upload that image to your Google Docs, and your job is done.
It goes without saying that Google Slides offers more options than Google Docs. you can do more edits and customize your infographics more.
But what if we told you there are graphic design tools that are as easy and intuitive to use but provide you with more editing options and a greater number of diverse templates?
One such tool is Glorify. Let’s see how you can easily create an infographic with this app.
What is Glorify?

It is this trait that makes Glorify a very intuitive and hassle-free platform.
Before we show you how to create stunning infographics with Glorify, let’s see some of its highlights.
Glorify: Features
Glorify’s most popular features are:
Infinite canvas - Provides you with limitless space to brainstorm, plan your strategy, organize your assets, etc.
Mockups - Enable you to create realistic, 3D mockups to showcase your products in high-quality.
Photo-editing tools - Help you tweak and edit your photos further in just a few clicks. Some of the most popular ones are BG remover, Shadows and reflections, Smart Resizer, etc.
Brand Kit - Enables you to store your logo and brand colors all in one place. This feature is great to help you stay consistent across the platforms.
Marketing campaign transformation - Provides pre-made template bundles automatically resized for all important social media channels and marketing campaigns.
Annotation tool - Highlights your product’s main features but also comes in handy for creating professional-looking charts and diagrams.
Share your design - Enables you to provide additional feedback and comments or simply save and export your work in multiple formats.
But let’s get back to what we’re here for today: creating infographics.
How to Create an Infographic Using Glorify?
Step 1: Choose a Template
Once you’ve signed up, you will see a Template Gallery.

In this case, choose the Infographic option and you will see all the templates in this category. You’ll end up on Glorify’s sleek and intuitive dashboard when you choose the template you like.
Step 2: Create an Infographic
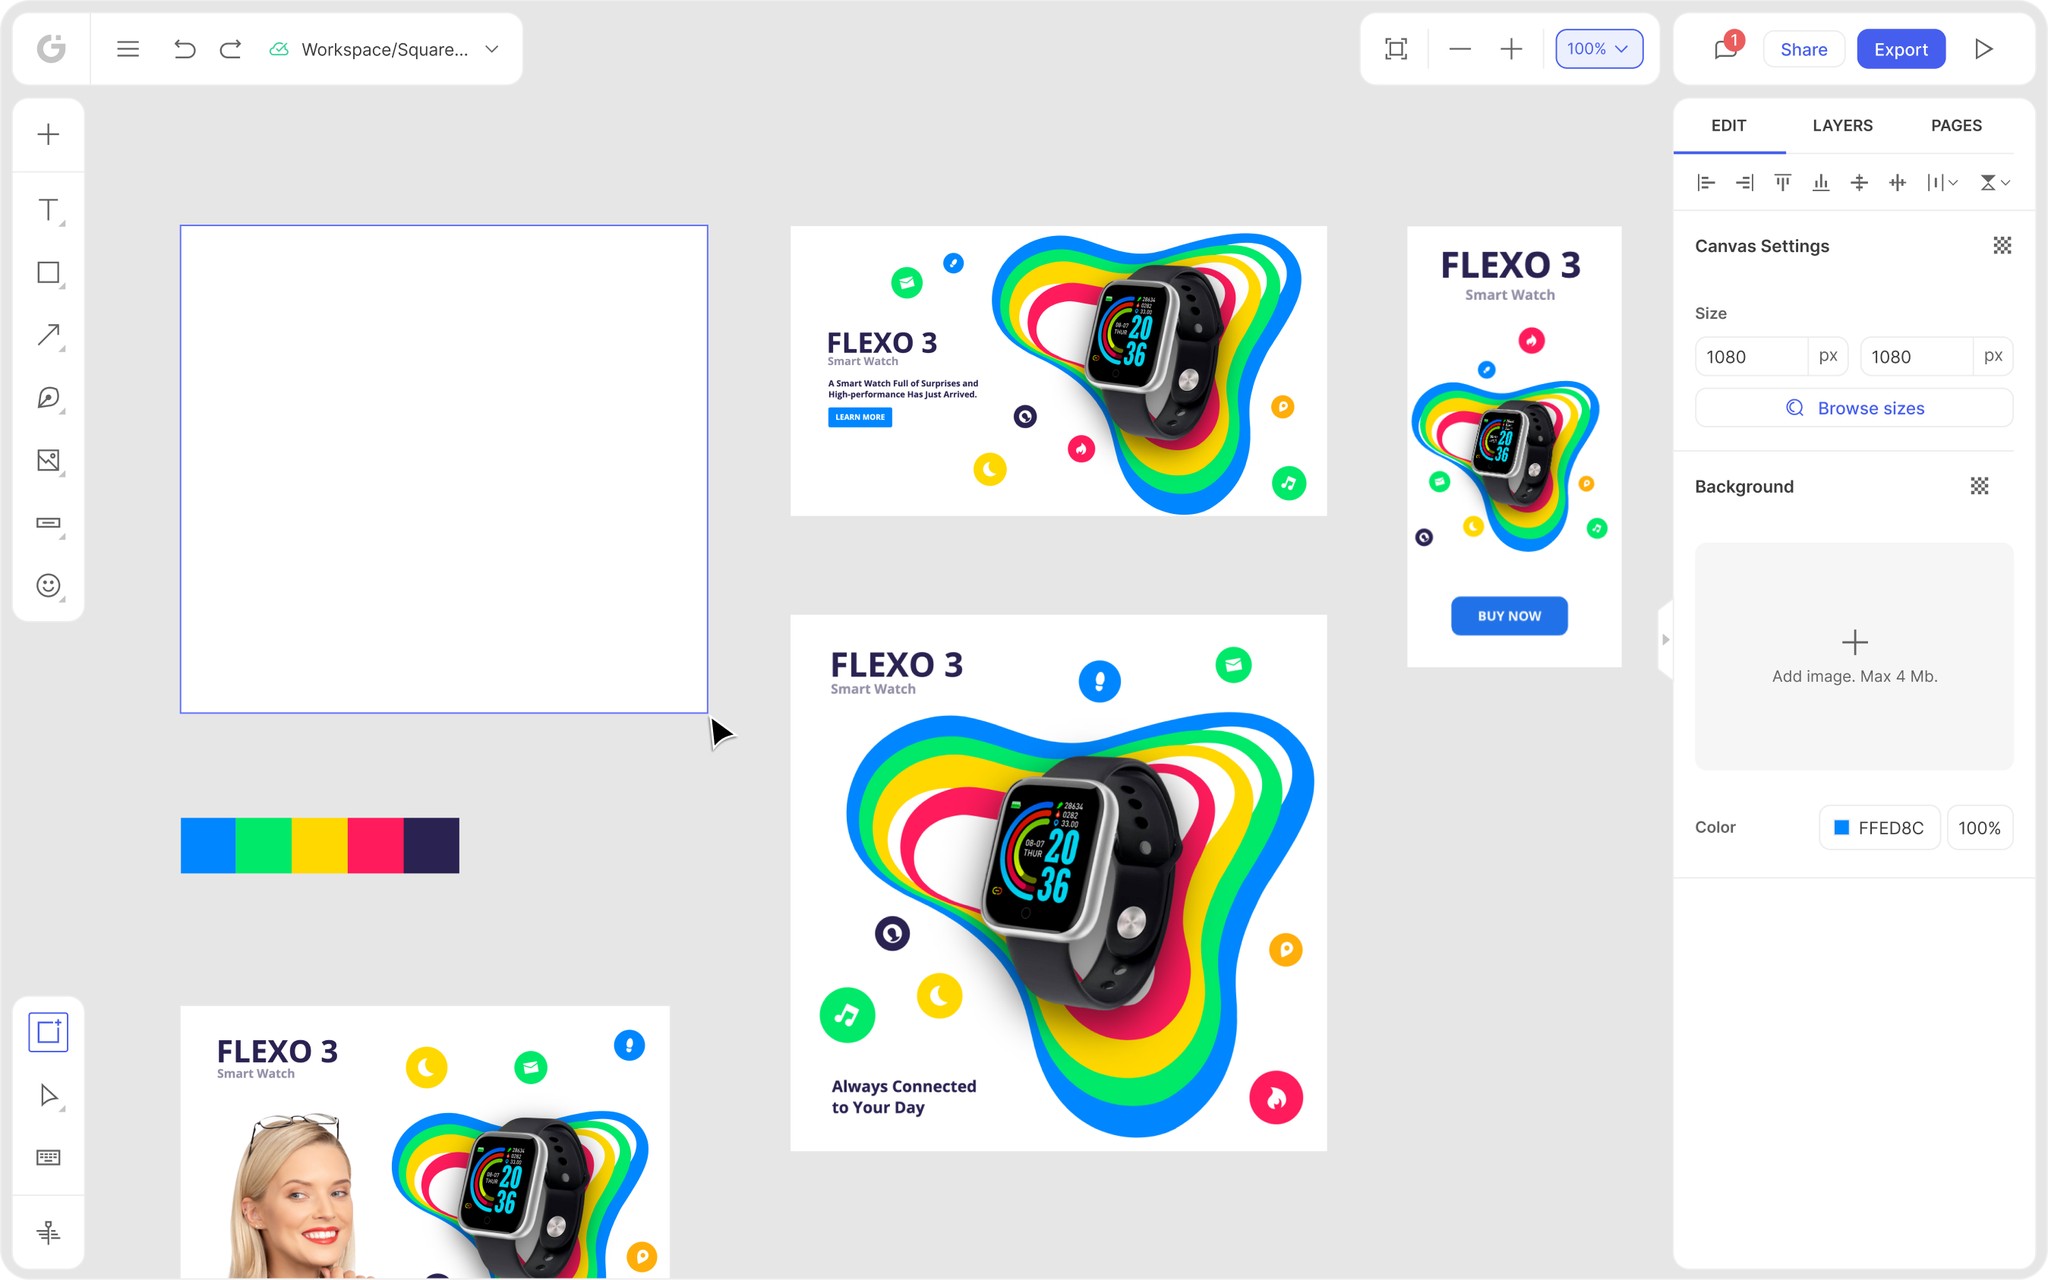
Glorify’s dashboard has two panels, the left-handed and the right-handed one.

The left one hosts elements like shapes, text, free images, mockup objects, logos, effects, etc, whereas the right one hosts features like layers, BG remover, color and text edits, etc.
By clicking on the individual element, you can easily replace them with a new element from Glorify’s Gallery or upload your images.
For most of the edits you will do, you will use a plus icon in the top right corner.

You can add more images, change or remove the background, and add text, effects, etc.
You’ll find everything you need in the left-side panel regarding changing or adding text. Like all the other edits in Glorify, everything takes a few clicks.

Be as creative as you want and explore all the features there are. You can always undo your changes till you hit the version you love the most.
Step 3: Save Your Infographic
The last thing to do is to export and save your design in one of the multiple formats: PNG, JPG, SVG, etc. And the same as with Google Slides, you just need to upload the saved image to your Google Docs.
Wrapping It Up
Infographics are silent heroes of marketing. So easily overlooked and yet so effective and powerful.
They combine stunning visuals with effective and punchy text. No extra information, no fluff.
As you saw, there are many tools that can help you create an infographic, but what sets Glorify apart from the tools we discussed today is that provides much more editing features and more templates which all lead to creating more unique infographics.
And unique is what you need because you need to cater to a specific audience.
Sign up today and explore a great pool of features to help you create perfect infographics.


Features
Alternatives


© 2019-2024 Glorify App - All rights reserved.